Where to find data if you don't have your own
It's actually not that hard if you know where to look.
One thing I notice about a lot of the opinion pieces and independent features making their way around the internet is that their sources are mostly just vibes.
We’re fluent in talking about issues, but when asked to present our sources, we find ourselves on shaky ground. We screenshot and repost figures that feel true, but only ever confirm what we believe in. In an era where generative AI makes disinformation increasingly undetectable, our relationship with real, verifiable, sourced data has never mattered more.
But a lot of this isn’t just a personal failing. Data can be notoriously hard to find! Thankfully, you don’t need a statistics degree or research budget: you just need to know where to look.
The internet has good data. It’s just not the type that goes viral.
Let's be real: most of us aren't stumbling across government statistical releases on our For You pages. The data that makes its way around is usually the type that’s easy to understand, grounded in emotion, and conveniently missing a source.
Examples of which can be your country’s statistics arm, like the Philippine Statistics Authority (PSA). I go here for raw population data, poverty incidence, employment rates, and consumer price indices: all neatly tabulated, regularly updated, and free. The Philippine Institute for Development Studies (PIDS) works too, as a source of comprehensive yet readable research and policy briefs.
.svg.png)
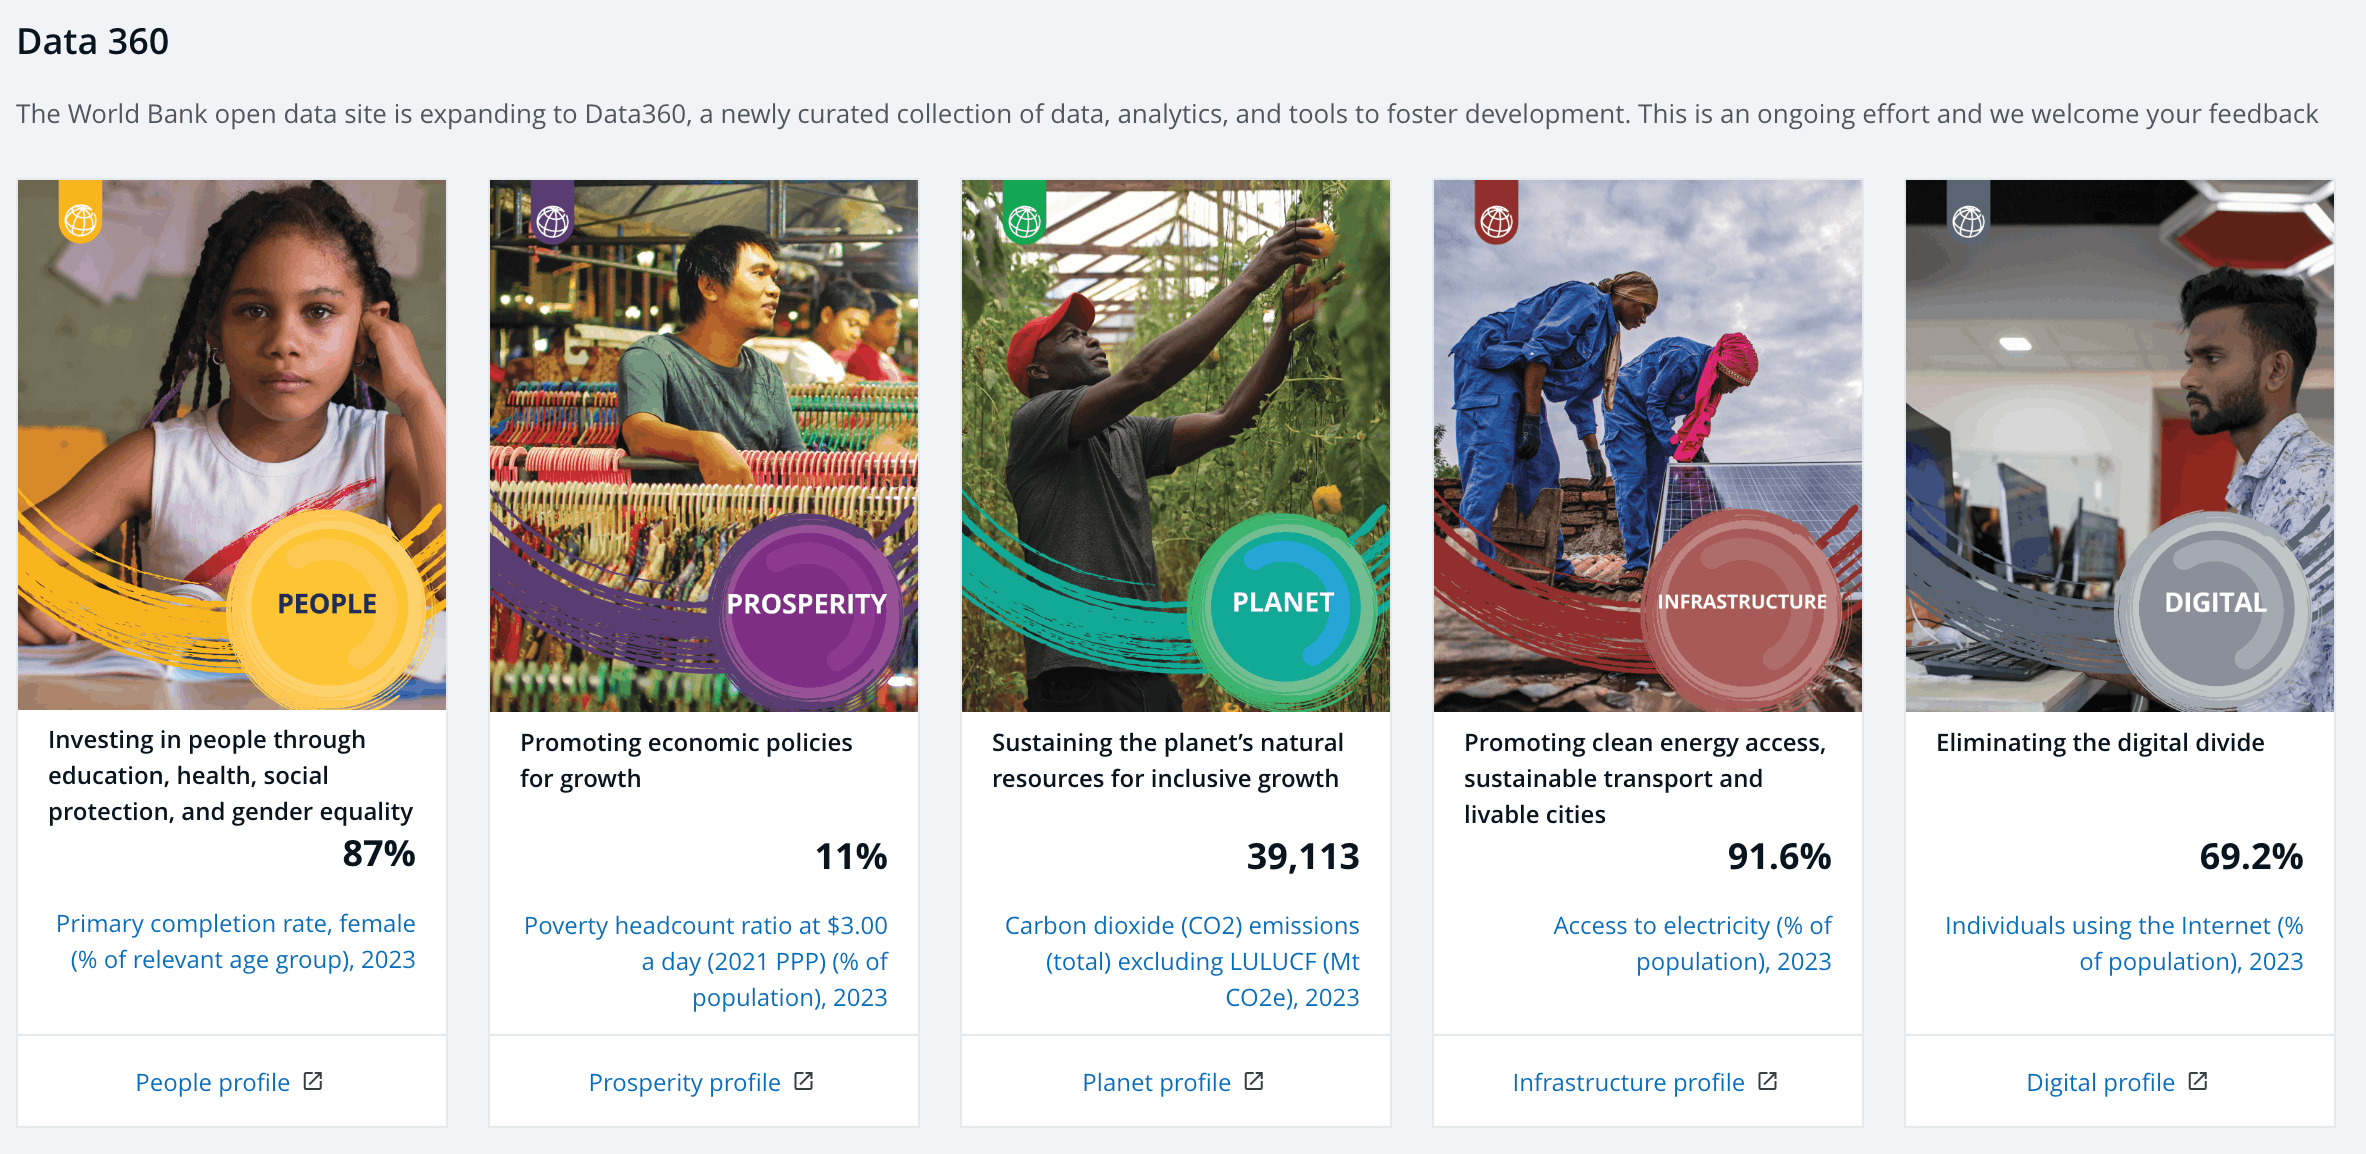
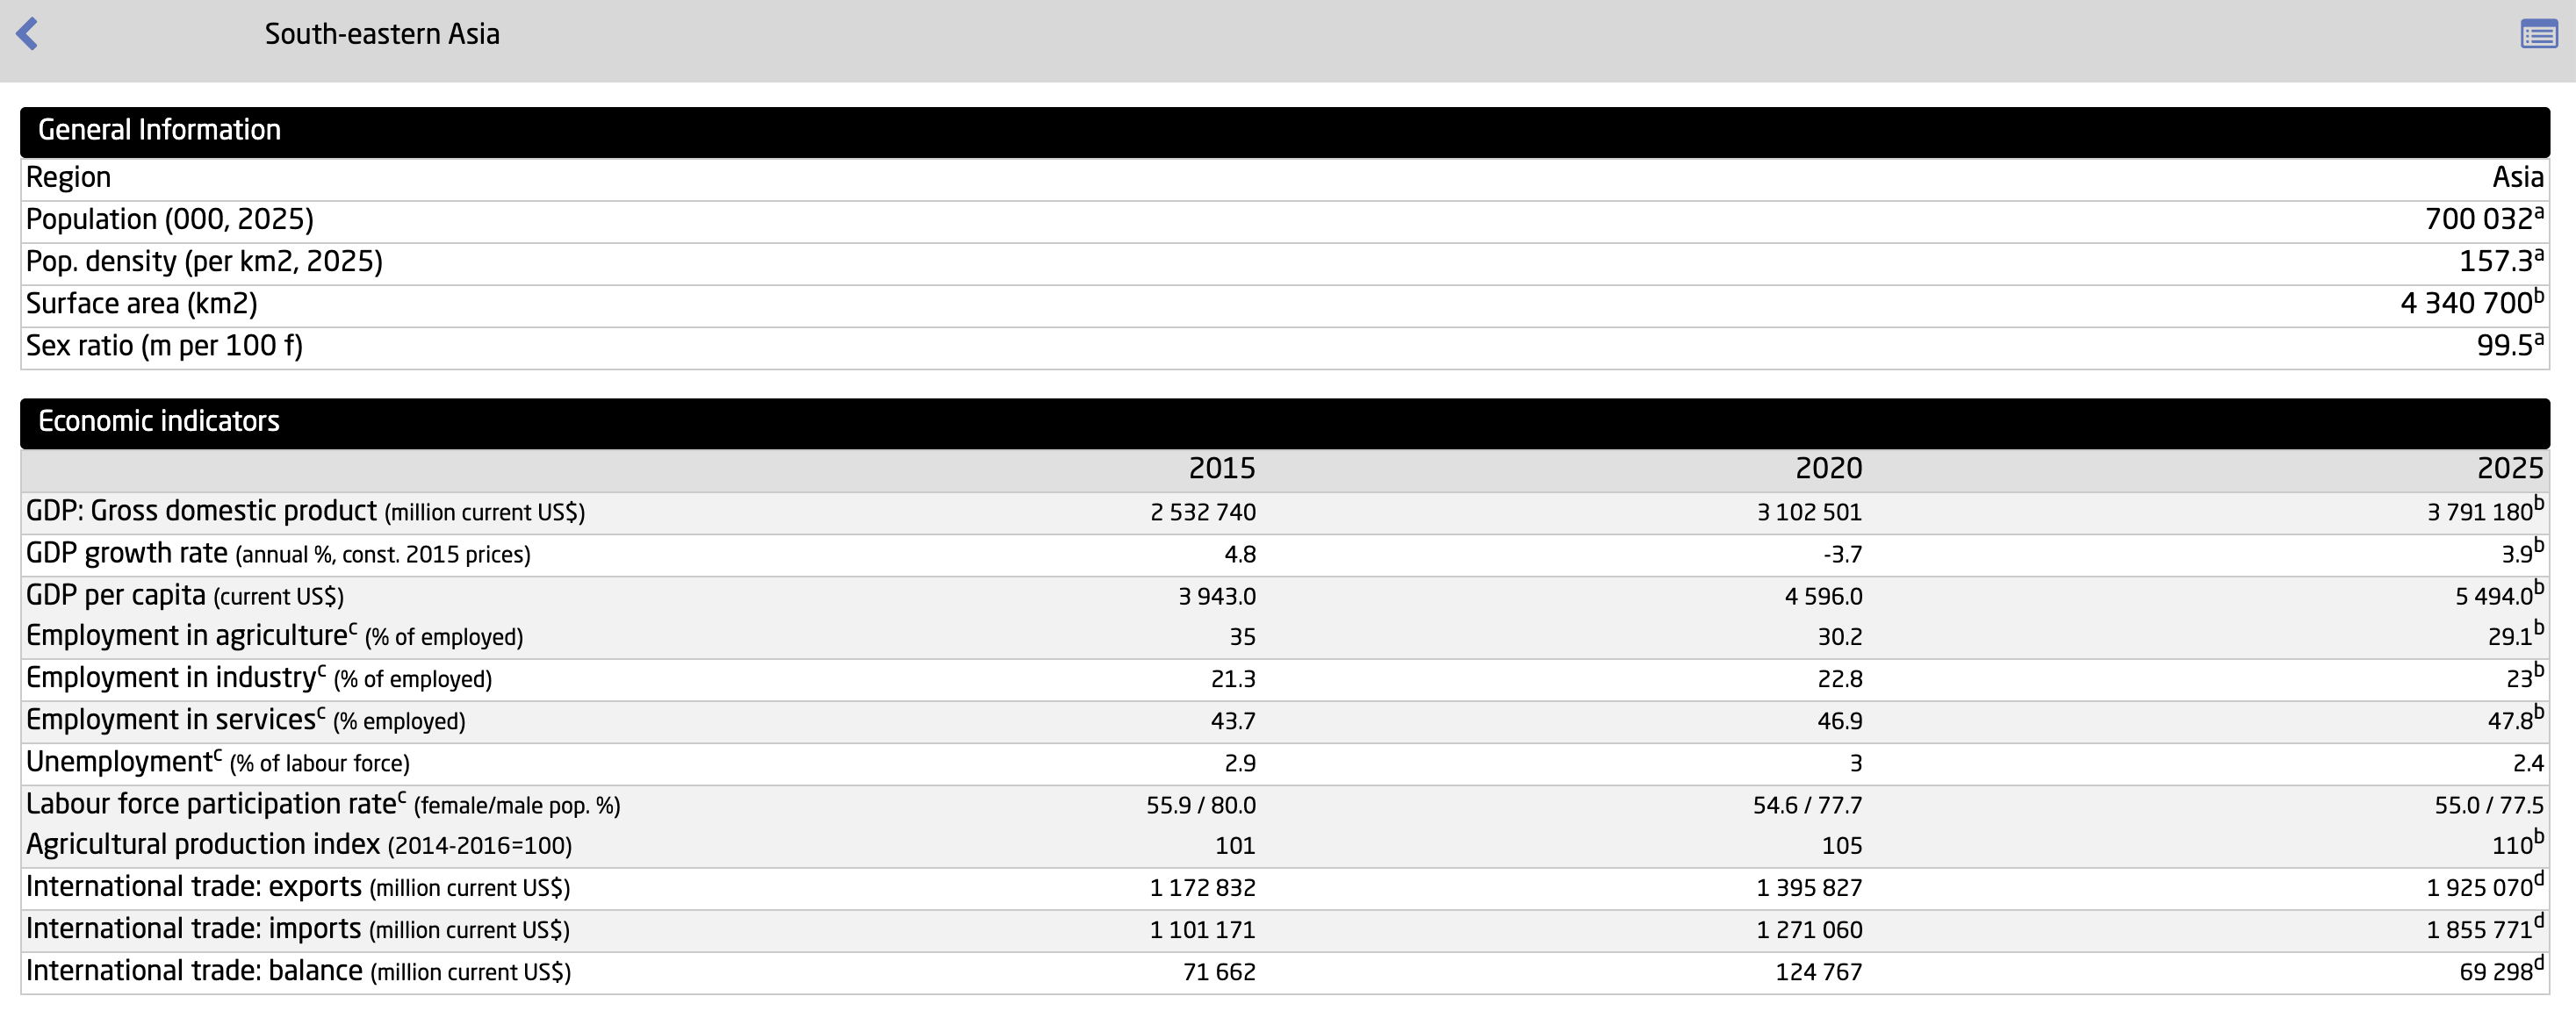
On a global scale, the World Bank Open Data portal and the United Nations Data platform are the equivalent. Both have free, downloadable datasets on everything from GDP per capita to maternal mortality rates, covering hundreds of countries across decades.
What are data sources to avoid?
Now that we’ve covered the places worth trusting, let’s sharpen your eye for sketchy sources. Some red flags to watch out for include:
✍🏼 No author or institution. If a statistic doesn't have a named source, it might as well have been made up yesterday.
🗺️ No methodology: Any reputable study or survey will tell you how it was conducted. But more on that in a bit.
🧮 Suspiciously perfect figures: Real-world data is messy. If something comes in at exactly 70% or 3 in 5 with no margin of error, chances are they’ve been rounded up or down or simplified for social media sharing.
🎗️ Neatly tied narratives: If a pharmaceutical company runs a study on the effectiveness of their own drug, or a survey by a consumer retail research agency shows their client brands in leading positions, it might be worth getting a second opinion.
How to make the most of what you find
Real, reliable datasets are admittedly intimidating to deal with, as a beginner. Maybe that’s why a lot of us opt for the first ones we see, that present information in easy-to-read packaging. But some of the tips and tricks I’ve learned along the way include:
Look for the methodology note. This is either at the bottom of the page, like we do on the Lapis website, or even a separate PDF. Learn how the data was collected: sample size, survey period, who was included and who wasn’t. A study that surveyed 200 people in one city cannot make claims across all demographics.
Check the date. Data from 2015 is not the same as data from 2025, especially when it’s about shifting topics like technology use, mental health, or housing costs. If you’re putting a story together or citing something for work, the more recent, the better.
Understand what the number is actually measuring. ‘Unemployment rate’ can mean many things. Do a deep dive to make sure if it’s talking about those who are actively looking for work, those who are underemployed, or those in freelance setups rather than traditional corporate offices.
TLDR
For readers who want a starting point that doesn’t require several hours of going down rabbit holes, here’s where I would go.
On climate and environment
Our World in Data’s climate section
The IPCC reports (Note: Look for the Summary for Policymakers — it’s written for non-scientists!)
NASA’s Global Climate Change data portal
On economy and labor
The World Bank Open Data portal
The International Labour Organization’s ILOSTAT database
On health
The World Health Organization's Global Health Observatory
The Global Burden of Disease study from the Institute for Health Metrics and Evaluation
On culture and society
The Pew Research Center for social attitudes, religion, media, and technology across countries
Locally speaking, Social Weather Stations and WR Numero are great sources for public opinion surveys
While these are some of the most credible names in my book, they certainly aren’t the only places to look. And that’s what sifting through data sources is all about: having the patience, determination, and critical eye needed to know which ones are worth your time.
In a media environment where we are constantly fed content designed to sway and manipulate, sometimes, this is our best line of defense. So, what do you say? Let’s get to work!